Inside Spring Boot /actuator/health Endpoint
Understanding what happens when you call /actuator/health of your Spring Boot application.
This is a personal note that I decided to share. It reflects my understanding of a subject and may contain errors and approximations. Feel free to contribute by contacting me here. Any help will be credited!
Spring Boot Actuator is a sub-project that helps to build production ready applications. It exposes much information about the application, via HTTP or JMX: monitoring, metrics, and even dumps. The power of actuator resides in its integration facility. It integrates perfectly with the application security and configuration.
Actuator is actively used with applications deployed on Kubernetes. A lot of developers use the /actuator/health endpoint with liveness and readiness probes.
Back in the days, I had an issue with an app turning unavailable randomly. I found that sometimes, there was a timeout on the actuator health endpoint. By default, the Kubernetes probe timeout is 1 second. At that time, I was wondering why the actuator health endpoint took more than 1 second to answer. And I figured out that I did not know what the actuator endpoint was exactly doing in the background.
In reality, a call to /actuator/healthtriggers several checks to application health indicators. The results are then aggregated and returned. If an indicator takes time to answer, then it generates random unavailability.
What is a Health Indicator?
Depending on the application components and integrations, multiple indicators are involved in the app’s health state.
Most of the time, an application has a datasource. The connection needs to be healthy to have an application up and running. For example, an application that uses Mongo as a datasource will have a MongoHealthIndicator. The indicator will perform a hello command to the database to evaluate the health status.
@Override
protected void doHealthCheck(Health.Builder builder) throws Exception {
    Document result = this.mongoTemplate.executeCommand("{ hello: 1 }");
    builder.up().withDetail("maxWireVersion",  result.getInteger("maxWireVersion"));
}
If the application has a mail integration with Spring JavaMailSenderImpl, then a MailHealthIndicator will be involved in the application health state.
@Override
protected void doHealthCheck(Builder builder) throws Exception {
    String host = this.mailSender.getHost();
    int port = this.mailSender.getPort();
    StringBuilder location = new StringBuilder((host != null) ? host : "");
    if (port != JavaMailSenderImpl.DEFAULT_PORT) {
       location.append(":").append(port);
    }
    if (StringUtils.hasLength(location)) {
       builder.withDetail("location", location.toString());
    }
    this.mailSender.testConnection();
    builder.up();
}
For applications deployed in Kubernetes, there are two helpful indicators LivenessStateHealthIndicator and ReadinessStateHealthIndicator. They use the ApplicationAvailibility bean from the Spring Boot package, which listens for ApplicationChangeEvent, an extension of Spring ApplicationEvent, dedicated to cloud-native application state management.
However, not all component integrations come with a HealthIndicator because it can be difficult to evaluate. This is the case with Kafka, for example.
Depending on the application configuration, the health state may differ significantly. If you use Kafka transactions, the application will need all brokers to be available and the transaction coordinator to be operational to be considered healthy. If you use Kafka with at most-once semantics, you can tolerate a broker being down temporarily (or more). The situation becomes even more complex when you consider that within a single application, you can have several Kafka configurations serving different purposes.
For this type of component integration, Actuator allows developers to code their own indicators, as we will see in the next section.
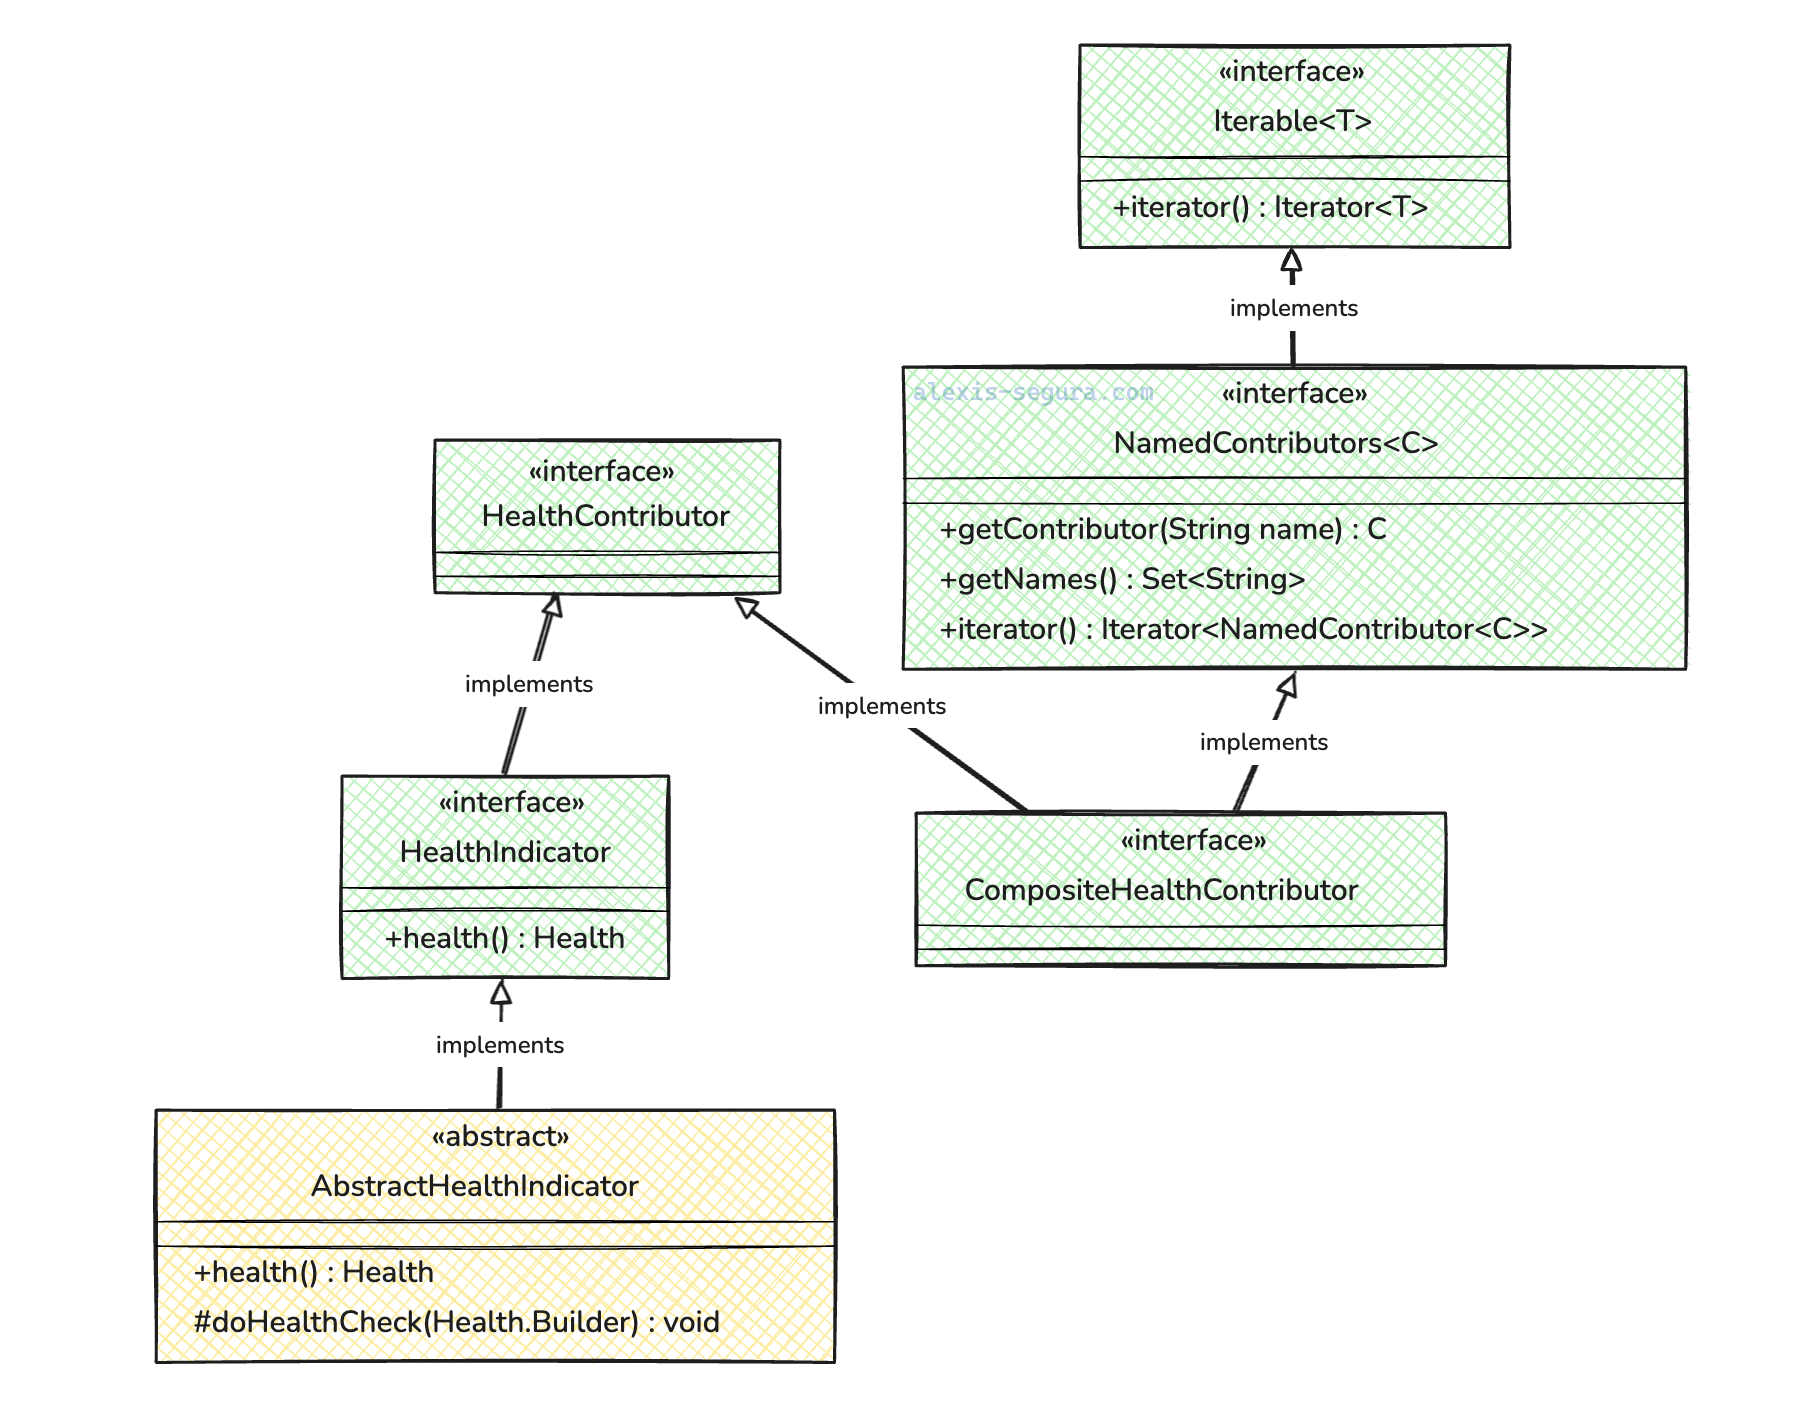
The Health Contributor Composite Pattern
At the core of actuator health indicators, there is a composite design pattern in action.
HealthContributor interface represents any component that can contribute health information to the application’s health status.
It has two implementations:
HealthIndicatorinterface representing a component that performs a single health check.CompositeHealthContributorinterface representing a component that aggregates multiple health checks. The pattern helps to create a nested structure of indicators.
HealthContributor (Component)
├── DataSourceHealthIndicator (Leaf)
├── RedisHealthIndicator (Leaf)
└── DatabaseCompositeHealthContributor (Composite)
	├── PrimaryDBHealthIndicator (Leaf)
	└── SecondaryDBHealthIndicator (Leaf)
Two other abstractions complete this mechanism:
AbstractHealthIndicatorthat encapsulates the health check, the logging, and the error handling.NamedContributorsinterface that provides named access to a collection of contributors.
HealthContributors are instantiated via auto-configuration based on beans existing in the application context. If you have a MongoTemplate, then the MongoHealthIndicator bean will be instantiated.
We can easily customize actuator by creating customs HealthContributor. We just need to extend AbstractHealthIndicator and implement the doHealthCheck method.
All contributors are then collected in a HealthContributorRegistry. It is possible to organize health indicators into groups inside the registry. Health groups are available on path /actuator/health/{groups}
Expose state with Health Endpoint
Spring team created an Endpoint abstraction, agnostic to the communication protocol.
The HealthEndpointis an Endpoint that only defines ReadOperation and WriteOperation.
Depending on the application configuration, an adaptation layer adapts the generic endpoint to the communication layer, either HTTP or JMX. The health endpoint is by default the only one exposed via HTTP.
The web adaptation layer instantiates web handlers for the HealthEndpoint and registers them in the Spring MVC handler mapping system, making them available in the DispatcherServlet. For applications using a reactive web server, the adaptation layer also creates handlers and registers them inside the WebFlux routing system’s DispatcherHandler.
Conclusion
Depending on the components you use, the frequency of health checks and the type of health indicators you have, you can expect some latency on the /actuator/health. If we go back to my issue, the different Health indicators from Apache Camel framework were quite long to execute, which lead kubernetes probe to timeout after 1 second.
In this post, we saw how the health state of a Spring Boot application is determined.
Actuator is a highly reliable framework that integrates perfectly with most Spring Boot applications. The framework design also makes the library very extensible, allowing each team to extend actuator endpoints to meet their needs.